
The recent updates to Google Analytics has made it possible for SEO professionals and webmasters to evaluate their social media presence and how it translates into actual user traffic and activity. Google Analytic’s new upgraded platform offers an exclusive social media section that wasn’t available in previous versions.
The social media section is a customized report that is located under Traffic Sources on the sidebar once a user logs into a specific website in Google Analytics. Under this report, users can track social media referrals, landing pages, trackbacks, conversions, visitors flow, plugins, and more.
Goals
To get the most out of the social media report, specific goals should already be set up for the entire website profile. Goals can be segmented by URL destination, visit duration, pages/visit, and event (such as completing a contact form or purchasing a product on the website). These metrics can all be utilized when looking at social media traffic. The Event goal type is especially useful, as it can show actual proof of how many sales come directly from social media traffic.
Once goals are set up, the social media report can display data better in a way that translates to goal completions (also sometimes known as conversions. In this case, they are called social conversions).
Social Value
Back in the social media report, after setting up goals, the report will display the chosen goal metrics, as well as a quick overview of overall visits and how many of those visits were from a social referral.
The Social Value section also shows traffic as broken down by each specific social media website, including lesser known networks, such as Tumblr and StumbleUpon. These reports can also be segmented by URLs visited and scheduled to be sent as a report every set interval (e.g. weekly, monthly, etc.)
Social Plug-In Analytics
The plug-in analytics are a great new feature of Google Analytics. According to Google, “If you have Google “+1” and Facebook “Like” buttons on your site, it’s important to know which buttons are being clicked and for which content. For example, if you publish articles on your site, you’ll want to know which articles are most commonly “liked” or shared, and from which social networks they’re being shared (for example, Google+ or Facebook). You can use this information to create more of the type of content that’s popular with your visitors. Also, if you find that some buttons are rarely used, you may wish to remove them to reduce clutter.
The Social Engagement reports allow you to see how people shared content on your site via social actions. Examples of social actions on your site that can be tracked include Google +1 button clicks, Facebook “Like” and “Send” interactions, and Del.icio.us bookmarks.”
By setting up plug-in analytics, it’s possible to get a good overview on how often social sharing buttons are used on your website. While different plugins may not always report the same social button interactions, utilizing this reporting feature in Google Analytics can give better overall information to average the reporting metrics for these social sharing reports.
Data Hub Activity
This section of the social media report deals with online discussion groups, commenting systems, blogging platforms, and other networks that allow users to discuss your website content on external websites. Basically, this section of the report is showing where users are discussing your website (provided they give a link to your website).
This is a great way to see where users are sharing your content and to get involved on those platforms, if possible. For instance, if the conversation is taking place in a commenting plug-in like Disqus, a representative of the company could log in an answer any questions from users directly on the platform where they originally asked the question.
This data can also help with advertising strategy– if a large number of users are discussing your website on another site, then it might be beneficial to advertise there if possible. It stands to reason that that advertisement will get more clicks (and possibly higher ROI) than an ad on a website that doesn’t have any current discussion about your website’s content.
Visitors Flow
The visitors flow chart is a great way to visually grasp the path that users use when getting to your website via social media. The chart provides a visual representation of the where users go after coming to a specific landing page on your website.
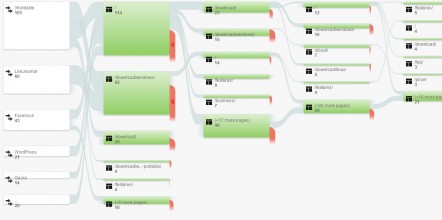
This chart can help you see what type of content is most interesting to your website visitors who are coming from social media, as well as what pages they are exiting your website from. This can go a long way when it comes to crafting content strategy and blog post ideas for your website, as well as published social media content.
All of these metrics can help you get the most out of utilizing Google Analytics for your social media campaigns.